
Contents
Introduction
Carbon emission has a great factor that has led to the deterioration of the ozone layer. Despite that our daily activities has in one way or another contributes to the menace, we try to coup and keep up with it. In our discussion, we will focus on the transport sector which is viewed to have a small contribution in the emission carbon to the environment,(Rutherford, D. 2018). The factor that contributes to the choice of the topic, is how we can decrease or eliminate carbon emission to its entirety.
Data
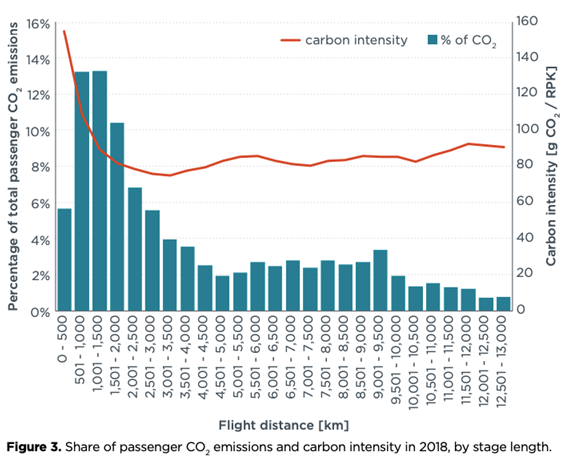
The presentation is based on researched and precise materials that was obtained from our daily activities. The research dates was between an year or less (2018-2018), where our unit conversion of the chart that was presented was 1000. Publication was entirely done by a specific body, UK Department for Business, Energy and Industrial Strategy (BEIS) which presents it as a true and certain data. The figure below, presents the chart obtained after the data was analysed in respect of the emission and the flight distance covered.
Methods.
Regression.
Regression it’s an analysis based on statistics which is essentially used to determine the connection between two variable, the independent and the dependent variables.Carlberg (2016), version on the model is that, it gives a coefficient of effect that either variable has on another. Also the presentation will contain a logarithmic functional form. Andy (2019), there are deviating units between the dependent and independent variables which coincides with a dependent variable. Logarithmic presentatio ussually gives a better result in relation of the percentages. Hence, we can change the specific units of both deendent and independent variables to get a more precise answer in relation to the percentages obtained. The coefficient table below presents the standard error, t-stat as well as the p-value of the carbon emmision that was obtained on analysis.
Coefficients Table
| Coefficients | Standard Error | t Stat | P-value | |
| Intercept | 0.281915021 | 0.104911537 | 2.687169 | 0.009705 |
Log( carbon) 1.73157818 0.115966529 14.93171 2.96E-20
The assumptions that are associated with the reserarch is that, emisions of carbon iv oxide are from vehicles, train and aeroplains. This disregards the same gas from being exposed to the air through burning of waste produts, decomposing wastes among others. Another assumption relates to the standard errrors which are associated with the calculations being presented.
Results
| Regression Statistics | |
| Multiple R | 0.90418548 |
| R Square | 0.81755139 |
| Adjusted R Square | 0.8068191 |
| Standard Error | 0.34005747 |
| Observations | 90 |
The regression table above shows that R square was obtained to be 0.81755139 which estimates that the percentages of both the independent and dependent variables varied with a rate of 81%.With the value being greater than 0.5, the conclusion is that the model is fit. The logarithmic presentation was essential in our analysis since it helped in the correction of the errors which may have been done in the model. The change in the value of R square to 81% depicts the errors which ought to have been made in the model. Hence it was ideal to have the changes from the percentages to logarithms.
Conclusion
It is evident that carbon dioxide can be decreased in terms of emission depending on the means of transport that we use. For instance the usage bicycles, walking can be such efficient means of transport that we can effectively use to move from one place to another. Arguably the usage of vehicles, airplanes and diesel engine trains will continuously destroy ozone layer through the emission of toxic toxins to the environment.
References
Andy. (2019, April 19). Logarithmic Transformation in Linear Regression Models: Why & When. Retrieved from DEV: https://dev.to/rokaandy/logarithmic-transformation-in-linear-regression-models-why-when-3a7c
Carlberg, C. (2016). Regression Analysis Microsoft Excel. Que Publishing Company.
Graver, B., Zhang, K. & Rutherford, D. (2018). CO2 emissions from commercial aviation, 2018. International Council on Clean Transportation.

